
🔍The use of the ‘goto’ statement in C programming is a controversial and debated topic. While ‘goto’ can be a powerful tool in certain situations, it can also lead to complex and hard-to-maintain code if used indiscriminately.
But there are scenarios where the use of the ‘goto’ statement in C cannot be easily substituted and can be helpful. The Linux kernel source code is a prominent example 🐧 where ‘goto’ is used extensively for a variety of reasons, including error handling and cleanup
🧐 Code Clarity: Code that uses ‘goto’ statements can become harder to read and understand, especially as the codebase grows. Avoid using ‘goto’ if there are alternative, clearer control flow structures, like loops and conditional statements (e.g., if, while, for).
🔗 Structured Programming: The use of ‘goto’ can violate the principles of structured programming, which emphasize structured control flow using loops and conditional statements to make code more predictable and maintainable.
🛠️ Error Handling: In some situations, ‘goto’ can be useful for error handling, especially when you need to perform cleanup actions before exiting a function. However, consider using a return statement or an exception mechanism, if available, as these can make error handling more explicit and readable.
🍝 Avoiding Spaghetti Code: Using ‘goto’ excessively can lead to “spaghetti code,” which is code that is difficult to follow and reason about due to a tangled web of jumps and labels. This makes maintenance and debugging challenging.
🔍 Limit Its Scope: If you decide to use ‘goto’, try to limit its scope to a small section of your code, and use it sparingly. It’s often better to use structured control flow constructs for most situations.
📚 Code Reviews: If you choose to use ‘goto’, consider thorough code reviews and document the reasons for its use so that other developers can understand the purpose.
🔄 Alternatives: In many cases, you can achieve the same functionality without ‘goto’ by restructuring your code. For example, you can use functions to encapsulate complex sections of code and return values to indicate the desired control flow.
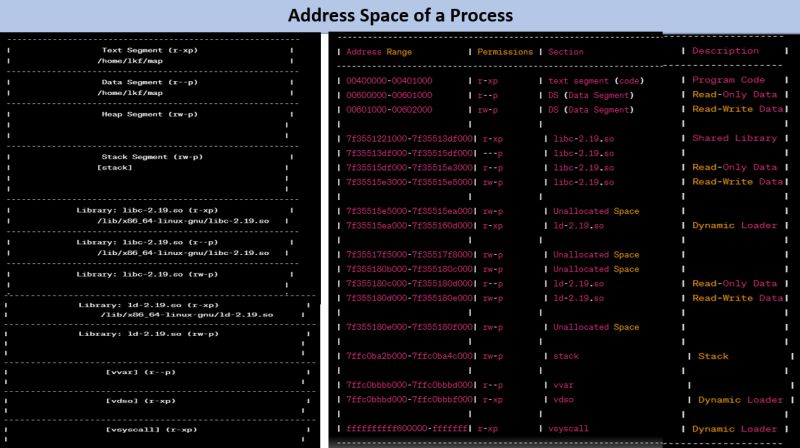
It is a detailed representation of the program’s address space and the associated permissions and descriptions of each memory region. This kind of memory layout information is highly relevant and crucial for an experienced embedded developer, especially when dealing with low-level system programming or debugging. 🕵️♂️🔬
The layout describes various segments, including text, data, libraries, heap, stack, and system-specific areas, and provides insights into how memory is organized and used by the program. 📜💡
💡 Understand Memory Usage: Gain a deep understanding of how memory is allocated and used by the program, which is essential for optimizing memory usage and identifying potential issues like memory leaks. 💡📈
💡 Debug Memory-related Issues: Easily spot anomalies in the memory layout, such as unexpected gaps or regions with unusual permissions, which can be indicative of memory-related problems. 🐛🛠️
💡 Identify Shared Libraries: Determine which shared libraries the program is using, along with their memory locations and permissions, helping in debugging and optimizing library usage. 📚🔍
💡 Analyze Performance: Evaluate how memory is organized, which can provide insights into the program’s performance and help identify bottlenecks related to memory access. 🚀📊
💡 Monitor Security: Keep an eye on memory regions with executable permissions to ensure that the program is not vulnerable to code injection attacks. 🛡️🔒
It’s the code under the hood, and this memory layout is your treasure map! 🗺️🧩
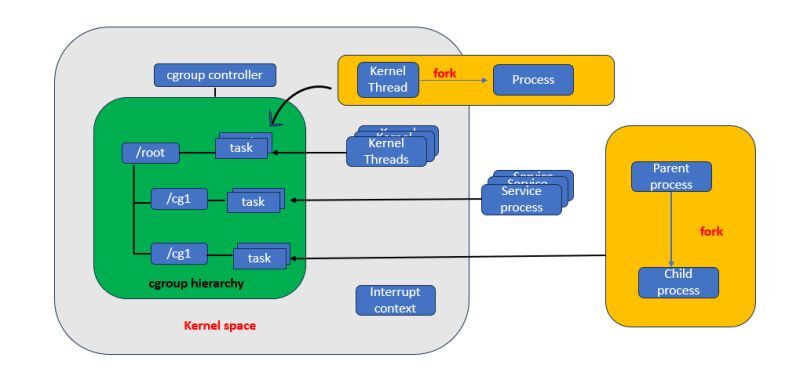
Cgroups are the backbone of effective system resource management in the Linux kernel, crucial for tasks like CPU, memory, disk I/O, and network control. They are the foundation of containerization, ensuring fair and controlled resource distribution. 🛠️💻
Resource management within cgroups is achieved through specialized controllers or subsystems that handle CPU, memory, I/O, and more. Linux containers, relying on cgroups, maintain resource boundaries for each instance, preventing resource monopolization. In cloud computing, cgroups facilitate resource allocation and usage tracking. ☁️💡
Cgroups employ a hierarchical structure that organizes tasks into a tree of controlled groups. Each task, such as a thread, belongs to one cgroup in a hierarchy but can be part of multiple cgroups across hierarchies. Subsystems enforce resource limits on these cgroups, enabling precise resource control. 🌳🔒
Common cgroup controllers include CPU, memory, I/O, device access, process management, network control, and more. The availability and features of these controllers can vary with kernel versions and configurations, offering flexibility for tailored resource management. To explore available controllers, check the /sys/fs/cgroup/ directory or use commands like ls /sys/fs/cgroup or cat /proc/cgroups. 🧰🔌🧩
Source code to be explored – source/kernel/cgroup/cgroup.c 🔍📄
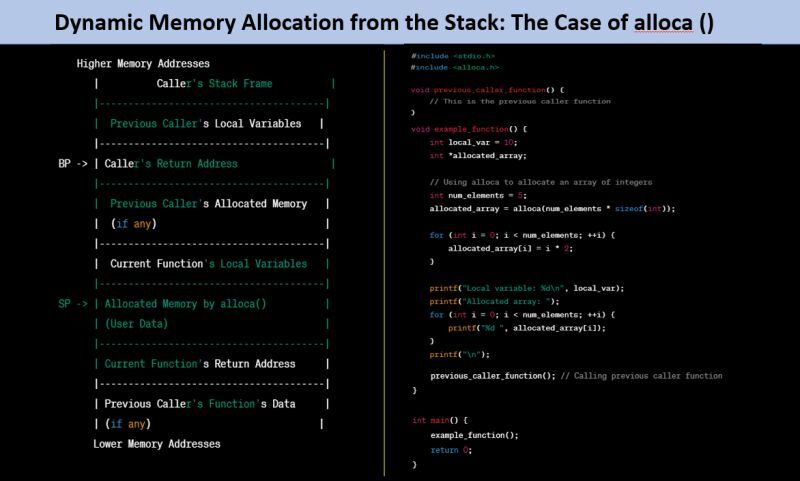
Have you ever wondered if memory allocation could be performed dynamically from the stack? 🤔 Let’s delve into a fascinating topic: the use of “alloca()” , a lesser-known function that allocates memory on the stack frame of the caller.
🌟 alloca dynamically allocates memory on the stack frame, ensuring that the allocated memory is automatically released when the function exits. This unique feature can be advantageous in certain scenarios where stack-based memory management is desired.
🌟 You must not! free() the pointer you get and it’s freed automatically after you exit the function.
🌟 Another advantage of alloca() is that it helps prevent stack fragmentation, a concern more prominent in heap memory management.
🛑 The primary reason to exercise caution with alloca() is its usage for large memory allocations. Allocating excessive stack memory can be inefficient and even lead to a potential stack overflow.
🛑 Why not use alloca in inlined functions : alloca() in functions that might be inlined can lead to unexpected behavior. The stack frame changes introduced by inlining can affect memory allocation and deallocation, resulting in undefined behavior.
🌟 In specific scenarios, alloca can be a powerful tool:
🔯 Variable-Length Buffers: When you need temporary storage for variable-length data structures, alloca can help by allowing you to allocate memory based on runtime conditions.
🔯 Custom Memory Pools: For short-lived memory needs, alloca can be a part of creating custom memory pools within functions.
a) Compiler Compatibility: 🛠️ Not all compilers support alloca, potentially limiting its usage across different development environments.
b) Interpretation Variability: 🔄 Compilers can interpret the intended behavior of alloca in diverse ways, leading to inconsistencies even among those that claim support.
c) Buggy Implementations: 🐞 Some implementations of alloca might contain bugs, introducing unpredictability and potential issues into the codebase.
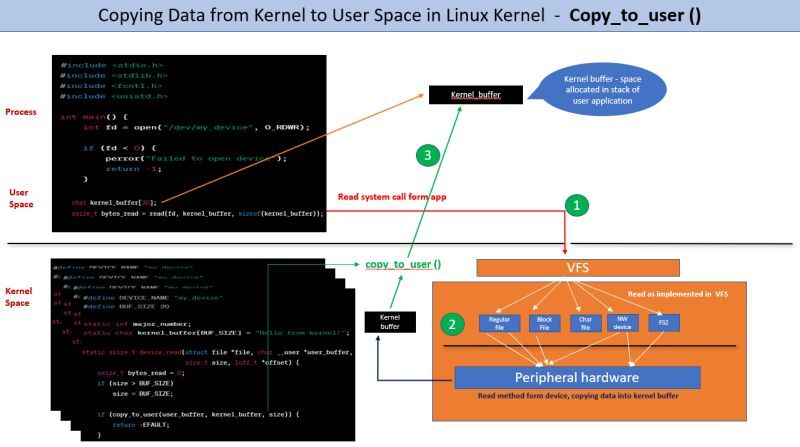
❓ Ever wondered how the Linux kernel ensures the secure and accurate transfer of data from kernel space to user space? Let’s dive into the algorithm used by the copy_to_user function!
static inline __must_check unsigned long
_copy_to_user(void __user *to, const void *from, unsigned long n)
{
might_fault();
if (should_fail_usercopy())
return n;
if (access_ok(to, n)) {
instrument_copy_to_user(to, from, n);
n = raw_copy_to_user(to, from, n);
}
return n;
}
1️⃣ Access Validity Check: The copy_to_user function checks whether the provided user space memory address (to pointer) is accessible and valid. This is done using the access_ok() function.
If the memory address is not valid, the function returns an error without copying data.
2️⃣ Calculating Copy Size: It calculates the size of the data to be copied. If the specified size exceeds the available user memory, the function adjusts the copy size accordingly.
3️⃣ Locking User Space: To prevent potential race conditions, the kernel locks the user space memory. This guarantees that the data being copied won’t be modified by the user process during copying.
4️⃣ Chunk-wise Copying: The function divides the data into manageable chunks (often machine word size) and copies them sequentially. This strategy optimizes copying efficiency.
5️⃣ Optimized Copy Mechanism: Leveraging hardware-specific instructions or architecture-specific memory copy routines, the kernel copies data efficiently. These routines take advantage of hardware features to speed up the copying process.
6️⃣ Handling Faults and Errors: If user space memory is inaccessible due to page faults, the kernel manages the situation. It ensures necessary page allocation and mapping to facilitate correct data copying.
7️⃣ Unlocking User Space: After copying, the lock on user space memory is released. This allows the user process to access the newly copied data.
By following this algorithm, the copy_to_user function guarantees secure and precise data transfer from kernel space to user space in the Linux kernel. This mechanism is crucial for maintaining the integrity and stability of the system.
⚡ Utilizing memcpy() to transfer a buffer from kernel space to user space in the Linux kernel may encounter issues due to the possibility of user space addresses being swapped out during the memcpy() operation. When the buffer points to a location in kernel memory, memcpy() can be employed to facilitate data copying. ⚡
Meet User Mode Linux (UML) – one of the most underrated yet powerful virtualization technologies that every embedded systems engineer should know!
𝐖𝐡𝐚𝐭 𝐦𝐚𝐤𝐞𝐬 𝐔𝐌𝐋 𝐬𝐩𝐞𝐜𝐢𝐚𝐥?
✅ Run Linux kernel as an application on your host system
✅ Debug kernel code using simple GDB – just like any regular app
✅ Kill and restart without any system impact
✅ Perfect sandbox for kernel development and testing
✅ Lightweight alternative to full virtualization
𝐈𝐧 𝐨𝐮𝐫 𝐜𝐨𝐮𝐫𝐬𝐞 𝐦𝐨𝐝𝐮𝐥𝐞, 𝐖𝐞 𝐰𝐚𝐥𝐤 𝐭𝐡𝐫𝐨𝐮𝐠𝐡:
Building BusyBox for UML architecture
Configuring and compiling Linux kernel for user mode
Creating proper root filesystem structure
Understanding the simulation mechanisms (timers via signals, interrupts via host mechanisms)
𝐏𝐫𝐚𝐜𝐭𝐢𝐜𝐚𝐥 𝐝𝐞𝐛𝐮𝐠𝐠𝐢𝐧𝐠 𝐭𝐞𝐜𝐡𝐧𝐢𝐪𝐮𝐞𝐬
Why this matters:
UML gives you the power of a complete Linux environment with the safety and simplicity of an application.
Perfect for learning, testing, and development without the overhead of traditional VMs.
🎯 Ready to master embedded Linux like a pro?
This is just one module from our comprehensive Embedded Linux course where we dive deep into:
– Kernel internals and customization
– Boot processes and optimization
– Real-world embedded system architecture
– Linux device driver
– Professional debugging techniques
__________________________________________________________________
𝐋𝐞𝐚𝐫𝐧𝐢𝐧𝐠 𝐎𝐩𝐩𝐨𝐫𝐭𝐮𝐧𝐢𝐭𝐢𝐞𝐬:
A) 𝐒𝐞𝐥𝐟-𝐏𝐚𝐜𝐞𝐝 𝐂𝐨𝐮𝐫𝐬𝐞:
𝐀𝐩𝐩𝐥𝐢𝐜𝐚𝐛𝐥𝐞 𝐟𝐨𝐫 𝐟𝐫𝐞𝐬𝐡𝐞𝐫𝐬 & 𝐞𝐱𝐩𝐞𝐫𝐢𝐞𝐧𝐜𝐞𝐝- 𝐏𝐥𝐚𝐜𝐞𝐦𝐞𝐧𝐭 𝐬𝐮𝐩𝐩𝐨𝐫𝐭 𝐚𝐩𝐩𝐥𝐢𝐜𝐚𝐛𝐥𝐞
Learn at your own pace
Structured kernel programming modules
Practical examples, bug study
Hands-on debugging experience
B) 𝐂𝐥𝐚𝐬𝐬𝐫𝐨𝐨𝐦 𝐓𝐫𝐚𝐢𝐧𝐢𝐧𝐠 𝐟𝐨𝐫 𝐅𝐫𝐞𝐬𝐡𝐞𝐫𝐬:
5 Months intensive program
Placement support
Real-world bug analysis
Kernel development fundamentals
Live projects & case studies
C) 𝐖𝐞𝐞𝐤𝐞𝐧𝐝 𝐎𝐧𝐥𝐢𝐧𝐞 𝐂𝐨𝐮𝐫𝐬𝐞 𝐟𝐨𝐫 𝐖𝐨𝐫𝐤𝐢𝐧𝐠 𝐏𝐫𝐨𝐟𝐞𝐬𝐬𝐢𝐨𝐧𝐚𝐥𝐬:
180+ Hours of training
8 Months comprehensive program
Flexible for working professionals
📽 𝐘𝐨𝐮𝐓𝐮𝐛𝐞 𝐜𝐡𝐚𝐧𝐧𝐞𝐥
https://lnkd.in/eYyNEqp
𝐌𝐨𝐝𝐮𝐥𝐞𝐬 𝐂𝐨𝐯𝐞𝐫𝐞𝐝 –
1) System Programming
2) Linux kernel internals
3) Linux device driver
4) Linux socket programming
5) Linux network device driver, PCI, USB driver code walk through, Linux
crash analysis and Kdump
7) JTag debugging
– 𝐏𝐫𝐢𝐜𝐢𝐧𝐠 :
https://lnkd.in/ePEK2pJh
📞 𝐂𝐨𝐧𝐭𝐚𝐜𝐭:
Click to WhatsApp: – https://lnkd.in/eYvqr49a
More Details: – https://lnkd.in/ehNz-sin
The Out of Memory (OOM) killer is Linux’s last resort when the system runs completely out of memory. It’s a kernel mechanism that:
Selects a “victim” process based on memory usage and importance scores
Terminates the process to free up memory for the system
Prevents total system freeze by sacrificing individual processes
Two critical race conditions in the OOM killer nearly broke Linux systems for years.
𝐓𝐡𝐞 𝐌𝐞𝐦𝐨𝐫𝐲 𝐃𝐞𝐚𝐭𝐡 𝐏𝐚𝐫𝐚𝐝𝐨𝐱
Linux systems face a brutal catch-22 during memory exhaustion:
Need to kill a process to free memory
Need memory to kill the process (for cleanup operations)
If no memory exists → potential system deadlock
𝐑𝐚𝐜𝐞 𝐂𝐨𝐧𝐝𝐢𝐭𝐢𝐨𝐧 #1: 𝐓𝐡𝐞 𝐈𝐧𝐟𝐢𝐧𝐢𝐭𝐞 𝐋𝐨𝐨𝐩
The Problem:
// Timeline of doom:
1. OOM killer selects victim → sets TIF_MEMDIE flag
2. Sends SIGKILL signal to victim
3. Victim task continues running (signal not processed yet)
4. Victim tries to allocate memory → fails (system OOM)
5. Victim retries with no watermarks → still fails
6. Loop back to step 4 → INFINITE LOOP!
The Solution Steps:
1. Detect death loop – Check if task marked for termination
2. Break the cycle – Fail allocation requests from doomed tasks
3. Allow natural death – Let process exit without infinite retries
4. Preserve critical allocations – Honor truly essential requests
Result: Doomed tasks die gracefully instead of crashing the system.
Production Impact: Entire server farms would hang during memory spikes, requiring hard reboots.
𝐑𝐚𝐜𝐞 𝐂𝐨𝐧𝐝𝐢𝐭𝐢𝐨𝐧 #2: 𝐏𝐫𝐨𝐜𝐞𝐬𝐬 𝐑𝐞-𝐬𝐞𝐥𝐞𝐜𝐭𝐢𝐨𝐧
The Problem:
// Multi-threaded process death race:
1. OOM killer selects Thread A → marks only Thread A as dying
2. Begins killing all threads in the process
3. NEW OOM event occurs during cleanup
4. Kernel looks for victim → finds Thread B (not marked!)
5. Selects SAME PROCESS again
6. Corrupted linked lists → potential infinite loop
𝐓𝐡𝐞 𝐒𝐨𝐥𝐮𝐭𝐢𝐨𝐧 𝐒𝐭𝐞𝐩𝐬:
1. Atomic process marking – Mark ALL threads simultaneously
2. Prevent re-selection – Block same process during cleanup
3. Protect data structures – Avoid linked list corruption
4. Ensure single kill – Each process terminated exactly once
Result: Clean process termination without data corruption or loops.
The OOM killer behaves completely differently depending on how memory runs out.
Different triggers = different behaviors:
Global system exhaustion vs. container limits
Critical kernel allocations vs. user requests
Memory leaks vs. fork bombs vs. swap thrashing
𝐂𝐨𝐫𝐞 𝐟𝐢𝐥𝐞𝐬 :
1) mm/oom_kill.c
2) linux/oom.h
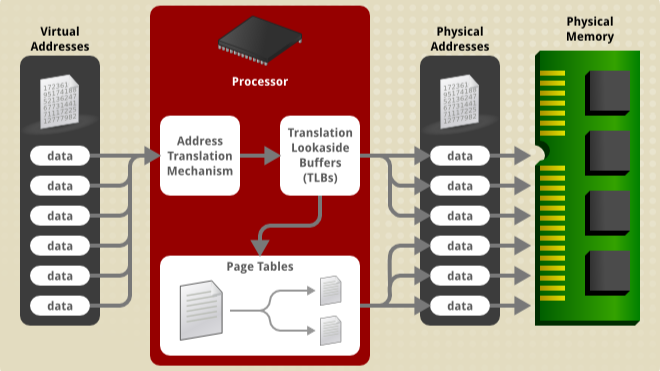
Did you know the kernel’s virtual memory layout is far more complex and largely hidden?
While most of us are familiar with user-space virtual memory in Linux, In this article, lets take a deep dive into the world of Linux kernel virtual memory, focusing on how the kernel handles memory, the magic behind bit 47, and the advanced techniques used to organize and protect memory spaces.
💡 𝐊𝐞𝐲 𝐡𝐢𝐠𝐡𝐥𝐢𝐠𝐡𝐭𝐬:
Canonical Addressing and the 128 TB kernel address space
The role of bit 47 in separating user and kernel space
KASLR: How the kernel randomizes memory for enhanced security
Real-world memory regions like Vmalloc, Vmemmap, and Kernel Text
👉 If you’re a developer, sysadmin, or security researcher, understanding these concepts is key to mastering Linux systems. Check out the full post to explore the architecture behind Linux’s virtual memory management!
Linux Kernel Virtual Memory Management: Exploring the Hidden Half
https://lnkd.in/gMMBmweh
How much memory you can really allocate with malloc() on a Linux system? Let’s look at some surprising test results:
What’s our physical memory?
$ free -h
total used free shared buff/cache available
Mem: 45Gi 6.4Gi 41Gi 444Mi 1.5Gi 38Gi
Swap: 0B 0B 0B
We have 45GB of RAM. 𝐒𝐨 𝐡𝐨𝐰 𝐦𝐮𝐜𝐡 𝐜𝐚𝐧 𝐰𝐞 𝐚𝐥𝐥𝐨𝐜𝐚𝐭𝐞 𝐰𝐢𝐭𝐡 𝐦𝐚𝐥𝐥𝐨𝐜()?
Testing maximum allocation with default settings
𝐓𝐄𝐒𝐓 1
$ ./vaflmalloc
Testing maximum allocation on your system
Maximum allocation found: 48672096256 bytes (45.33 GB, 0.04 TB)
Interesting! We can allocate roughly the same amount as our physical RAM.
𝐁𝐮𝐭 𝐰𝐡𝐲?
Also When does malloc use brk() vs mmap()?
𝐓𝐄𝐒𝐓 2:
Examining Threshold Size for Direct mmap
Testing allocation strategy by size:
Size Uses mmap?
————————-
65536 No
131072 No
262144 No
524288 No
1048576 No
4194304 No
16777216 Yes
33554432 Yes
So malloc() uses the heap (via brk()) for allocations under 16MB and switches to mmap() for larger ones.
𝐁𝐮𝐭 𝐰𝐚𝐢𝐭 – 𝐡𝐨𝐰 𝐝𝐨𝐞𝐬 𝐭𝐡𝐞 𝐬𝐲𝐬𝐭𝐞𝐦 𝐞𝐧𝐟𝐨𝐫𝐜𝐞 𝐭𝐡𝐚𝐭 45𝐆𝐁 𝐥𝐢𝐦𝐢𝐭?
Let’s check the vm.overcommit setting:
$ cat /proc/sys/vm/overcommit_memory
0
What happens if we change the overcommit setting?
$ sysctl -w vm.overcommit_memory=1
vm.overcommit_memory = 1
$ ./vaflmalloc
Testing maximum allocation on your system
Maximum allocation found: 76965814468608 bytes (71680.00 GB, 70.00 TB)
WOW!
By changing one tunable parameter, we went from allocating 45GB to 70TB
𝐁𝐮𝐭 𝐜𝐚𝐧 𝐰𝐞 𝐠𝐨 𝐞𝐯𝐞𝐧 𝐟𝐮𝐫𝐭𝐡𝐞𝐫 𝐰𝐢𝐭𝐡 𝐝𝐢𝐫𝐞𝐜𝐭 𝐦𝐦𝐚𝐩()?
$ ./aflmmap
Testing maximum mmap allocation
Attempting to mmap 137438953472000 bytes (125.00 TB)
SUCCESS: Mapped 137438953472000 bytes (125.00 TB) at address 0x2f4f39f9000
Incredible!
Direct mmap() calls can allocate up to 125TB – almost double what malloc() can handle!
𝐒𝐨 𝐰𝐡𝐚𝐭’𝐬 𝐠𝐨𝐢𝐧𝐠 𝐨𝐧 𝐡𝐞𝐫𝐞?
There’s a fascinating interplay between
– Virtual vs physical memory
– The vm.overcommit_memory kernel tunable
– How malloc() uses brk() & mmap()
– Virtual memory fragmentation
For a detailed explanation & real system call traces, check out my full article.
https://shorturl.at/xzSGp
Learn More – Selfpaced recorded course & Live Online classes.
𝐋𝐢𝐯𝐞 𝐎𝐧𝐥𝐢𝐧𝐞 𝐁𝐚𝐭𝐜𝐡 – 𝐒𝐭𝐚𝐫𝐭𝐢𝐧𝐠 – 1𝐬𝐭 𝐉𝐮𝐧𝐞 2025
– 𝐁𝐚𝐭𝐜𝐡 𝐒𝐭𝐚𝐫𝐭𝐢𝐧𝐠 – 1𝐬𝐭 𝐉𝐮𝐧𝐞 2025
– (Sat & Sun) – 170+ Hrs.
– Weekend online course for working professionals.
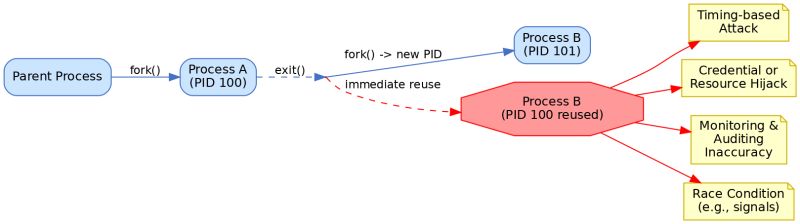
Linux does not immediately recycle process identifiers (PIDs) for new processes after a process exits. Instead, PIDs are allocated sequentially up to a maximum and only reused after the range wraps around.
𝐊𝐞𝐲 𝐑𝐞𝐚𝐬𝐨𝐧𝐬 𝐟𝐨𝐫 𝐀𝐯𝐨𝐢𝐝𝐢𝐧𝐠 𝐈𝐦𝐦𝐞𝐝𝐢𝐚𝐭𝐞 𝐏𝐈𝐃 𝐑𝐞𝐮𝐬𝐞:
𝐓𝐡𝐰𝐚𝐫𝐭𝐢𝐧𝐠 𝐓𝐢𝐦𝐢𝐧𝐠-𝐁𝐚𝐬𝐞𝐝 𝐀𝐭𝐭𝐚𝐜𝐤𝐬:
Prevents attackers from predicting when a PID will be free and immediately acquiring it. This blocks attackers from spawning malicious processes with the same PID as just-terminated privileged processes.
𝐏𝐫𝐞𝐯𝐞𝐧𝐭𝐢𝐧𝐠 𝐂𝐫𝐞𝐝𝐞𝐧𝐭𝐢𝐚𝐥/𝐑𝐞𝐬𝐨𝐮𝐫𝐜𝐞 𝐇𝐢𝐣𝐚𝐜𝐤𝐢𝐧𝐠:
Blocks impersonation attacks where a new process might inherit security tokens or permissions from a recently terminated process with the same PID.
𝐌𝐚𝐢𝐧𝐭𝐚𝐢𝐧𝐢𝐧𝐠 𝐀𝐜𝐜𝐮𝐫𝐚𝐭𝐞 𝐌𝐨𝐧𝐢𝐭𝐨𝐫𝐢𝐧𝐠 & 𝐀𝐮𝐝𝐢𝐭𝐢𝐧𝐠:
Ensures that system monitors, loggers, and auditing tools can accurately track processes without confusion. At any given moment, each PID refers to only one specific process.
𝐀𝐯𝐨𝐢𝐝𝐢𝐧𝐠 𝐑𝐚𝐜𝐞 𝐂𝐨𝐧𝐝𝐢𝐭𝐢𝐨𝐧𝐬:
Eliminates dangerous race conditions where system operations (signals, /proc access, etc.) might accidentally target a new process that inherited a PID instead of the intended original process.
𝐂𝐡𝐞𝐜𝐤 𝐝𝐞𝐬𝐢𝐠𝐧 𝐜𝐡𝐚𝐧𝐠𝐞𝐬-
linux.git/commit/?id=5fdee8c4a5e1800489ce61963208f8cc55e42ea1
linux/v4.14.336/source/kernel/pid.c
linux/v6.15-rc4/source/kernel/pid.c
1) 𝐂𝐨𝐫𝐞 𝐀𝐥𝐥𝐨𝐜𝐚𝐭𝐢𝐨𝐧 𝐌𝐞𝐜𝐡𝐚𝐧𝐢𝐬𝐦
nr = idr_alloc_cyclic(&tmp->idr, NULL, pid_min, pid_max, GFP_ATOMIC);
2) 𝐏𝐈𝐃 𝐑𝐚𝐧𝐠𝐞 𝐌𝐚𝐧𝐚𝐠𝐞𝐦𝐞𝐧𝐭
// Determine minimum PID value for allocation
int pid_min =1;
if(idr_get_cursor(&tmp->idr)> RESERVED_PIDS)
pid_min = RESERVED_PIDS;
3) 𝐋𝐚𝐫𝐠𝐞 𝐏𝐈𝐃 𝐒𝐩𝐚𝐜𝐞 𝐂𝐨𝐧𝐟𝐢𝐠𝐮𝐫𝐚𝐭𝐢𝐨𝐧
init_pid_ns.pid_max =min(pid_max_max,max_t(int, init_pid_ns.pid_max, PIDS_PER_CPU_DEFAULT *num_possible_cpus()));
pid_max_min =max_t(int, pid_max_min, PIDS_PER_CPU_MIN *num_possible_cpus());
4) 𝐍𝐚𝐦𝐞𝐬𝐩𝐚𝐜𝐞 𝐈𝐬𝐨𝐥𝐚𝐭𝐢𝐨𝐧
struct pid_namespace init_pid_ns = {
.ns.count =REFCOUNT_INIT(2),
.idr =IDR_INIT(init_pid_ns.idr),
// …
};
𝐓𝐡𝐞 𝐬𝐲𝐬𝐭𝐞𝐦 𝐩𝐫𝐞𝐯𝐞𝐧𝐭𝐬 𝐢𝐦𝐦𝐞𝐝𝐢𝐚𝐭𝐞 𝐏𝐈𝐃 𝐫𝐞𝐮𝐬𝐞 𝐛𝐲:
– Using Cyclic PID allocation
– Maintaining a large PID space.
– Ensuring PIDs are not reused until the entire PID space is exhausted
– Providing namespace isolation for container environments
Learn more –
𝐋𝐢𝐯𝐞 𝐎𝐧𝐥𝐢𝐧𝐞 𝐁𝐚𝐭𝐜𝐡 – 𝐒𝐭𝐚𝐫𝐭𝐢𝐧𝐠 – 1𝐬𝐭 𝐉𝐮𝐧𝐞 2025
– 𝐁𝐚𝐭𝐜𝐡 𝐒𝐭𝐚𝐫𝐭𝐢𝐧𝐠 – 1𝐬𝐭 𝐉𝐮𝐧𝐞 2025
– (Sat & Sun) – 170+ Hrs. ( 7-8 Months program )
– Weekend online course for working professionals.
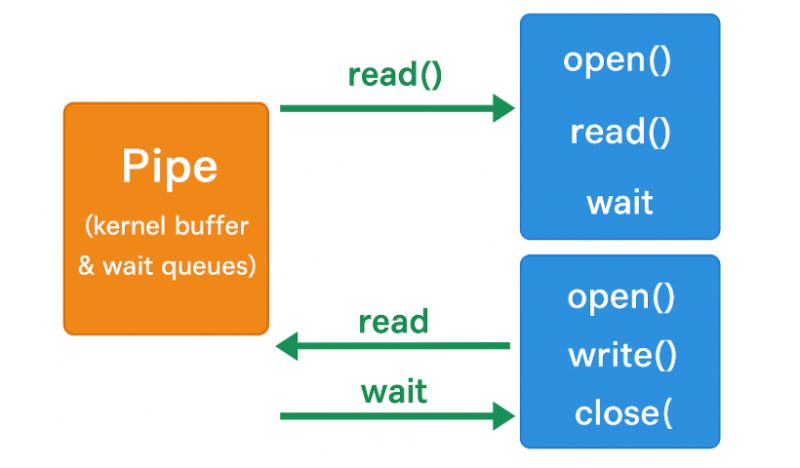
A bug fix that reveals important insights about pipe design and concurrent programming.
𝐓𝐡𝐞 𝐂𝐨𝐫𝐞 𝐃𝐞𝐬𝐢𝐠𝐧 𝐨𝐟 𝐋𝐢𝐧𝐮𝐱 𝐏𝐢𝐩𝐞𝐬
Pipes are deceptively simple yet sophisticated IPC mechanisms:
– Kernel Buffer: A fixed-size circular buffer (typically 64KB) managed by the kernel
– Two-sided Interface: Write end (producers) & read end (consumers)
– Wait Queues: Separate queues for readers & writers to block when necessary
– Reference Counters: Track the number of readers & writers
𝐒𝐩𝐞𝐜𝐢𝐚𝐥 𝐒𝐭𝐚𝐭𝐞 𝐓𝐫𝐚𝐧𝐬𝐢𝐭𝐢𝐨𝐧𝐬:
Last writer closing → All readers get EOF
Last reader closing → Writers get SIGPIPE
𝐓𝐡𝐞 𝐏𝐞𝐫𝐟𝐨𝐫𝐦𝐚𝐧𝐜𝐞 𝐎𝐩𝐭𝐢𝐦𝐢𝐳𝐚𝐭𝐢𝐨𝐧 𝐚𝐧𝐝 𝐭𝐡𝐞 𝐁𝐮𝐠
Linux kernel commit 0ddad21d3e99 (“pipe: use exclusive waits when reading or writing”) introduced a significant performance optimization in fs/pipe.c:
/* Before optimization – wake all processes */
wake_up_interruptible(&pipe->wait);
/* After optimization – wake only one process at a time */
wake_up_interruptible_sync_poll(&pipe->rd_wait, EPOLLIN | EPOLLRDNORM);
wake_up_interruptible_sync_poll(&pipe->wr_wait, EPOLLOUT | EPOLLWRNORM);
Change dramatically improved performance:
Context switches reduced by 90% (11.2M → 1.2M)
Execution time reduced by 88% (14.6s → 1.7s)
𝐂𝐨𝐫𝐧𝐞𝐫 𝐂𝐚𝐬𝐞: when the last writer closed a pipe, only ONE reader would be notified instead of ALL readers, leaving other readers blocked indefinitely.
𝐓𝐡𝐞 𝐄𝐥𝐞𝐠𝐚𝐧𝐭 𝐅𝐢𝐱
The commit 6551d5c56eb0 (“pipe: make sure to wake up everybody when the last reader/writer closes”) fixed the issue with an elegant solution in the pipe_release function:
/* Before fix */
if (pipe->readers || pipe->writers) {
wake_up_interruptible_sync_poll(&pipe->rd_wait, EPOLLIN | EPOLLRDNORM | EPOLLERR | EPOLLHUP);
wake_up_interruptible_sync_poll(&pipe->wr_wait, EPOLLOUT | EPOLLWRNORM | EPOLLERR | EPOLLHUP);
kill_fasync(&pipe->fasync_readers, SIGIO, POLL_IN);
kill_fasync(&pipe->fasync_writers, SIGIO, POLL_OUT);
}
/* After fix */
if (!pipe->readers != !pipe->writers) {
wake_up_interruptible_all(&pipe->rd_wait);
wake_up_interruptible_all(&pipe->wr_wait);
kill_fasync(&pipe->fasync_readers, SIGIO, POLL_IN);
kill_fasync(&pipe->fasync_writers, SIGIO, POLL_OUT);
}
The fix introduces a clever logical condition that triggers only when one side is completely closed but the other still has attachments.
(!pipe->readers != !pipe->writers)
is true exactly when:
No writers but some readers
OR
No readers but some writers
Ftrace is a powerful tracing utility built directly into the Linux kernel that allows developers to trace kernel function calls with minimal overhead. It lives in the kernel’s debugfs, typically mounted at
/𝐬𝐲𝐬/𝐤𝐞𝐫𝐧𝐞𝐥/𝐝𝐞𝐛𝐮𝐠/𝐭𝐫𝐚𝐜𝐢𝐧𝐠/
𝐒𝐞𝐭𝐭𝐢𝐧𝐠 𝐔𝐩 𝐅𝐭𝐫𝐚𝐜𝐞
The provided example shows how to configure Ftrace:
mount -t debugfs nodev /sys/kernel/debug
cd /sys/kernel/debug/tracing
# Set function graph tracer
echo function_graph > current_tracer
# Filter for specific functions
echo ‘__x64_sys_brk’ >> set_ftrace_filter
echo ‘do_brk_flags’ >> set_ftrace_filter
echo ‘__x64_sys_mmap’ >> set_ftrace_filter
echo ‘__x64_sys_mmap_pgoff’ >> set_ftrace_filter
echo ‘do_mmap’ >> set_ftrace_filter
echo ‘vm_mmap’ >> set_ftrace_filter
echo ‘vm_mmap_pgoff’ >> set_ftrace_filter
echo ‘get_unmapped_area’ >> set_ftrace_filter
echo ‘vm_unmapped_area’ >> set_ftrace_filter
# Enable tracing
echo 1 > tracing_on
𝐅𝐭𝐫𝐚𝐜𝐞 𝐢𝐧 𝐀𝐜𝐭𝐢𝐨𝐧: 𝐌𝐞𝐦𝐨𝐫𝐲 𝐌𝐚𝐧𝐚𝐠𝐞𝐦𝐞𝐧𝐭 𝐄𝐱𝐚𝐦𝐩𝐥𝐞
Let’s analyze the output from a memory test program calling brk, mmap etc:
— Testing brk() syscall —
Initial program break: 0x425000
Program break increased by 1MB: 0x525000
Successfully wrote to the allocated memory
Program break restored: 0x425000
— Testing mmap() syscall —
Anonymous mapping at: 0x7f95fc9f2000
Wrote to anonymous mapping: Testing anonymous mapping
Anonymous mapping unmapped
File mapping at: 0x7f95fc9f2000
First 20 bytes of /etc/passwd: root:x:0:0:root:/roo
File mapping unmapped
Fixed mapping at requested address 0x600000000000
Map with – linux/v6.14.5/source/mm/mmap.c
𝐅𝐭𝐫𝐚𝐜𝐞 𝐫𝐞𝐯𝐞𝐚𝐥𝐬 𝐭𝐡𝐞 𝐞𝐱𝐞𝐜𝐮𝐭𝐢𝐨𝐧 𝐩𝐚𝐭𝐡 𝐰𝐢𝐭𝐡 𝐭𝐢𝐦𝐢𝐧𝐠 𝐝𝐞𝐭𝐚𝐢𝐥𝐬:
4) __x64_sys_mmap() {
4) vm_mmap_pgoff() {
4) do_mmap() {
4) get_unmapped_area() {
4) vm_unmapped_area();
4) }
4) }
4) }
4) }
𝐏𝐞𝐫𝐟𝐨𝐫𝐦𝐚𝐧𝐜𝐞 𝐢𝐧𝐬𝐢𝐠𝐡𝐭𝐬:
14) __x64_sys_mmap() {
14) 4.440 us | do_mmap();
14) 4.881 us | }
𝐅𝐨𝐫 𝐟𝐢𝐱𝐞𝐝 𝐦𝐚𝐩𝐩𝐢𝐧𝐠𝐬:
6) __x64_sys_mmap() {
6) 1.794 us | do_mmap();
6) ! 409.690 us | } <— exclamation mark indicates a long execution time
𝐁𝐞𝐧𝐞𝐟𝐢𝐭𝐬 𝐟𝐨𝐫 𝐃𝐞𝐛𝐮𝐠𝐠𝐢𝐧𝐠
– Function call hierarchy: Seeing what functions are called in what order
– Performance measurement: Precise timing of each function
– Bottleneck identification: Finding unexpectedly slow operations
– System understanding: Revealing implementation details of system calls
𝐋𝐢𝐦𝐢𝐭𝐚𝐭𝐢𝐨𝐧𝐬 𝐚𝐧𝐝 𝐂𝐡𝐚𝐥𝐥𝐞𝐧𝐠𝐞𝐬
– Kernel-only visibility: Limited to kernel space, doesn’t show userspace activities
– Buffer constraints: Trace buffers can overflow during extended tracing
– Security implications: May expose sensitive kernel information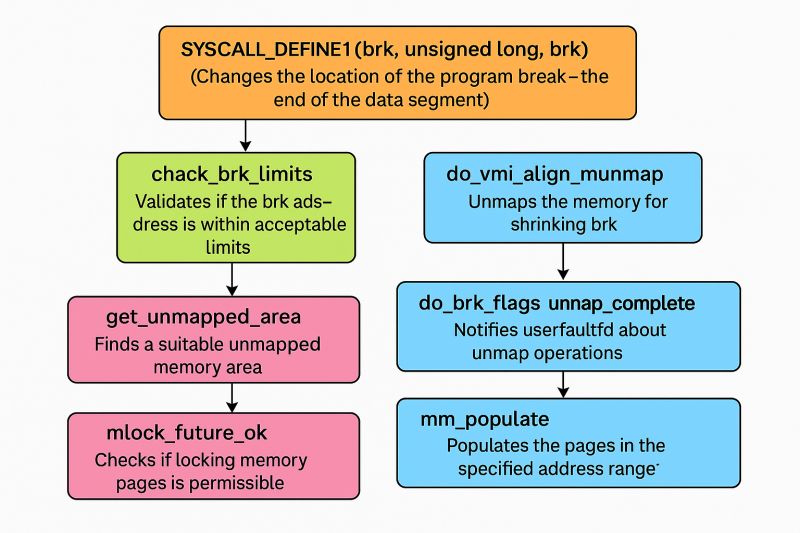
Linux does not immediately recycle process identifiers (PIDs) for new processes after a process exits. Instead, PIDs are allocated sequentially up to a maximum and only reused after the range wraps around.
𝐊𝐞𝐲 𝐑𝐞𝐚𝐬𝐨𝐧𝐬 𝐟𝐨𝐫 𝐀𝐯𝐨𝐢𝐝𝐢𝐧𝐠 𝐈𝐦𝐦𝐞𝐝𝐢𝐚𝐭𝐞 𝐏𝐈𝐃 𝐑𝐞𝐮𝐬𝐞:
𝐓𝐡𝐰𝐚𝐫𝐭𝐢𝐧𝐠 𝐓𝐢𝐦𝐢𝐧𝐠-𝐁𝐚𝐬𝐞𝐝 𝐀𝐭𝐭𝐚𝐜𝐤𝐬:
Prevents attackers from predicting when a PID will be free and immediately acquiring it. This blocks attackers from spawning malicious processes with the same PID as just-terminated privileged processes.
𝐏𝐫𝐞𝐯𝐞𝐧𝐭𝐢𝐧𝐠 𝐂𝐫𝐞𝐝𝐞𝐧𝐭𝐢𝐚𝐥/𝐑𝐞𝐬𝐨𝐮𝐫𝐜𝐞 𝐇𝐢𝐣𝐚𝐜𝐤𝐢𝐧𝐠:
Blocks impersonation attacks where a new process might inherit security tokens or permissions from a recently terminated process with the same PID.
𝐌𝐚𝐢𝐧𝐭𝐚𝐢𝐧𝐢𝐧𝐠 𝐀𝐜𝐜𝐮𝐫𝐚𝐭𝐞 𝐌𝐨𝐧𝐢𝐭𝐨𝐫𝐢𝐧𝐠 & 𝐀𝐮𝐝𝐢𝐭𝐢𝐧𝐠:
Ensures that system monitors, loggers, and auditing tools can accurately track processes without confusion. At any given moment, each PID refers to only one specific process.
𝐀𝐯𝐨𝐢𝐝𝐢𝐧𝐠 𝐑𝐚𝐜𝐞 𝐂𝐨𝐧𝐝𝐢𝐭𝐢𝐨𝐧𝐬:
Eliminates dangerous race conditions where system operations (signals, /proc access, etc.) might accidentally target a new process that inherited a PID instead of the intended original process.
𝐂𝐡𝐞𝐜𝐤 𝐝𝐞𝐬𝐢𝐠𝐧 𝐜𝐡𝐚𝐧𝐠𝐞𝐬-
linux.git/commit/?id=5fdee8c4a5e1800489ce61963208f8cc55e42ea1
linux/v4.14.336/source/kernel/pid.c
linux/v6.15-rc4/source/kernel/pid.c
1) 𝐂𝐨𝐫𝐞 𝐀𝐥𝐥𝐨𝐜𝐚𝐭𝐢𝐨𝐧 𝐌𝐞𝐜𝐡𝐚𝐧𝐢𝐬𝐦
nr = idr_alloc_cyclic(&tmp->idr, NULL, pid_min, pid_max, GFP_ATOMIC);
2) 𝐏𝐈𝐃 𝐑𝐚𝐧𝐠𝐞 𝐌𝐚𝐧𝐚𝐠𝐞𝐦𝐞𝐧𝐭
// Determine minimum PID value for allocation
int pid_min =1;
if(idr_get_cursor(&tmp->idr)> RESERVED_PIDS)
pid_min = RESERVED_PIDS;
3) 𝐋𝐚𝐫𝐠𝐞 𝐏𝐈𝐃 𝐒𝐩𝐚𝐜𝐞 𝐂𝐨𝐧𝐟𝐢𝐠𝐮𝐫𝐚𝐭𝐢𝐨𝐧
init_pid_ns.pid_max =min(pid_max_max,max_t(int, init_pid_ns.pid_max, PIDS_PER_CPU_DEFAULT *num_possible_cpus()));
pid_max_min =max_t(int, pid_max_min, PIDS_PER_CPU_MIN *num_possible_cpus());
4) 𝐍𝐚𝐦𝐞𝐬𝐩𝐚𝐜𝐞 𝐈𝐬𝐨𝐥𝐚𝐭𝐢𝐨𝐧
struct pid_namespace init_pid_ns = {
.ns.count =REFCOUNT_INIT(2),
.idr =IDR_INIT(init_pid_ns.idr),
// …
};
𝐓𝐡𝐞 𝐬𝐲𝐬𝐭𝐞𝐦 𝐩𝐫𝐞𝐯𝐞𝐧𝐭𝐬 𝐢𝐦𝐦𝐞𝐝𝐢𝐚𝐭𝐞 𝐏𝐈𝐃 𝐫𝐞𝐮𝐬𝐞 𝐛𝐲:
– Using cursor-based sequential, cyclic PID allocation
– Maintaining a large PID space.
– Ensuring PIDs are not reused until the entire PID space is exhausted
– Providing namespace isolation for container environments
𝐒𝐨𝐮𝐫𝐜𝐞𝐬:
Stack Overflow – Linux PID recycling behavior
GitHub Issue – Kernel avoids quick PID reassignments to prevent issues
Exploit-DB (Polkit) – Timing attack & auth hijack via PID reuse
Security StackExchange – PID uniquely identifies an active process
Superuser – Quick PID reuse seen as a security hazard
Walking through a real-world Linux kernel bug resolution process. The case study focused on a regression where Silicon Motion NVMe controllers stopped being detected after a kernel update.
The complete lifecycle of kernel bug handling through bugzilla.kernel.org
How NVMe’s architecture provides superior performance over traditional SATA (64K command queues vs. just a mere 32 commands!)
The intricate relationship between PCIe subsystems and storage drivers
Source code analysis of the NVMe driver’s device detection and initialization process
The actual bug fix was elegantly simple but required deep understanding:
The issue was in how the driver handled the DNR (Do Not Retry) status bit.
The original code had the logic backward – it was:
if (status > 0 && !(status & NVME_SC_DNR))
But it should have been:
if (status > 0 && (status & NVME_SC_DNR))
This seemingly small change fixed critical detection issues with Silicon Motion controllers, ensuring that non-retryable errors are properly ignored while retryable errors are correctly propagated.
Are you interested in developing these advanced Linux kernel debugging skills? Our next Linux Kernel and Device Driver Development course starts soon!
𝐆𝐞𝐭 𝐡𝐚𝐧𝐝𝐬-𝐨𝐧 𝐞𝐱𝐩𝐞𝐫𝐢𝐞𝐧𝐜𝐞 𝐰𝐢𝐭𝐡:
Linux kernel module structure and initialization
PCIe device enumeration and driver binding
Storage subsystem architecture
Reading technical specifications and applying them to code
Understanding kernel patch submission workflow
𝐔𝐬𝐞𝐟𝐮𝐥 𝐫𝐞𝐬𝐨𝐮𝐫𝐜𝐞𝐬:
Kernel.org Bugzilla: https://lnkd.in/gBvyD_f4
Bug 208583 – Regression – nvme not detected
_____________________________
📽 𝐘𝐨𝐮𝐓𝐮𝐛𝐞 𝐜𝐡𝐚𝐧𝐧𝐞𝐥
https://lnkd.in/eYyNEqp
𝐌𝐨𝐝𝐮𝐥𝐞𝐬 𝐂𝐨𝐯𝐞𝐫𝐞𝐝 –
1) System Programming
2) Linux kernel internals
3) Linux device driver
4) Linux socket programming
5) Linux network device driver, PCI, USB driver code walk through, Linux
crash analysis and Kdump
7) JTag debugging
– 𝐏𝐫𝐢𝐜𝐢𝐧𝐠 :
https://lnkd.in/ePEK2pJh
𝐋𝐞𝐚𝐫𝐧𝐢𝐧𝐠 𝐎𝐩𝐩𝐨𝐫𝐭𝐮𝐧𝐢𝐭𝐢𝐞𝐬:
A) 𝐒𝐞𝐥𝐟-𝐏𝐚𝐜𝐞𝐝 𝐂𝐨𝐮𝐫𝐬𝐞:
Learn at your own pace
Structured kernel programming modules
Practical examples, bug study
Hands-on debugging experience
B) 𝐂𝐥𝐚𝐬𝐬𝐫𝐨𝐨𝐦 𝐓𝐫𝐚𝐢𝐧𝐢𝐧𝐠 𝐟𝐨𝐫 𝐅𝐫𝐞𝐬𝐡𝐞𝐫𝐬:
5 Months intensive program
Placement support
Real-world bug analysis
Kernel development fundamentals
Live projects & case studies
C) 𝐖𝐞𝐞𝐤𝐞𝐧𝐝 𝐎𝐧𝐥𝐢𝐧𝐞 𝐂𝐨𝐮𝐫𝐬𝐞 𝐟𝐨𝐫 𝐖𝐨𝐫𝐤𝐢𝐧𝐠 𝐏𝐫𝐨𝐟𝐞𝐬𝐬𝐢𝐨𝐧𝐚𝐥𝐬:
180+ Hours of training
8 Months comprehensive program
Flexible for working professionals
📞 𝐂𝐨𝐧𝐭𝐚𝐜𝐭:
Click to WhatsApp: – https://lnkd.in/eYvqr49a
More Details: – https://lnkd.in/ehNz-sin
Phone: +91 9620769990